Crafting an Infographic Syllabus
Heather Kuhaneck 5-7-25
In the digital age, educators continuously seek innovative ways to present course information that is engaging, clear, and accessible. An infographic syllabus transforms the traditional text-heavy syllabus into a visually appealing, concise, and informative document. This blog post explores the benefits of creating an infographic syllabus and provides practical steps for OT educators to design one.
What is an Infographic Syllabus?
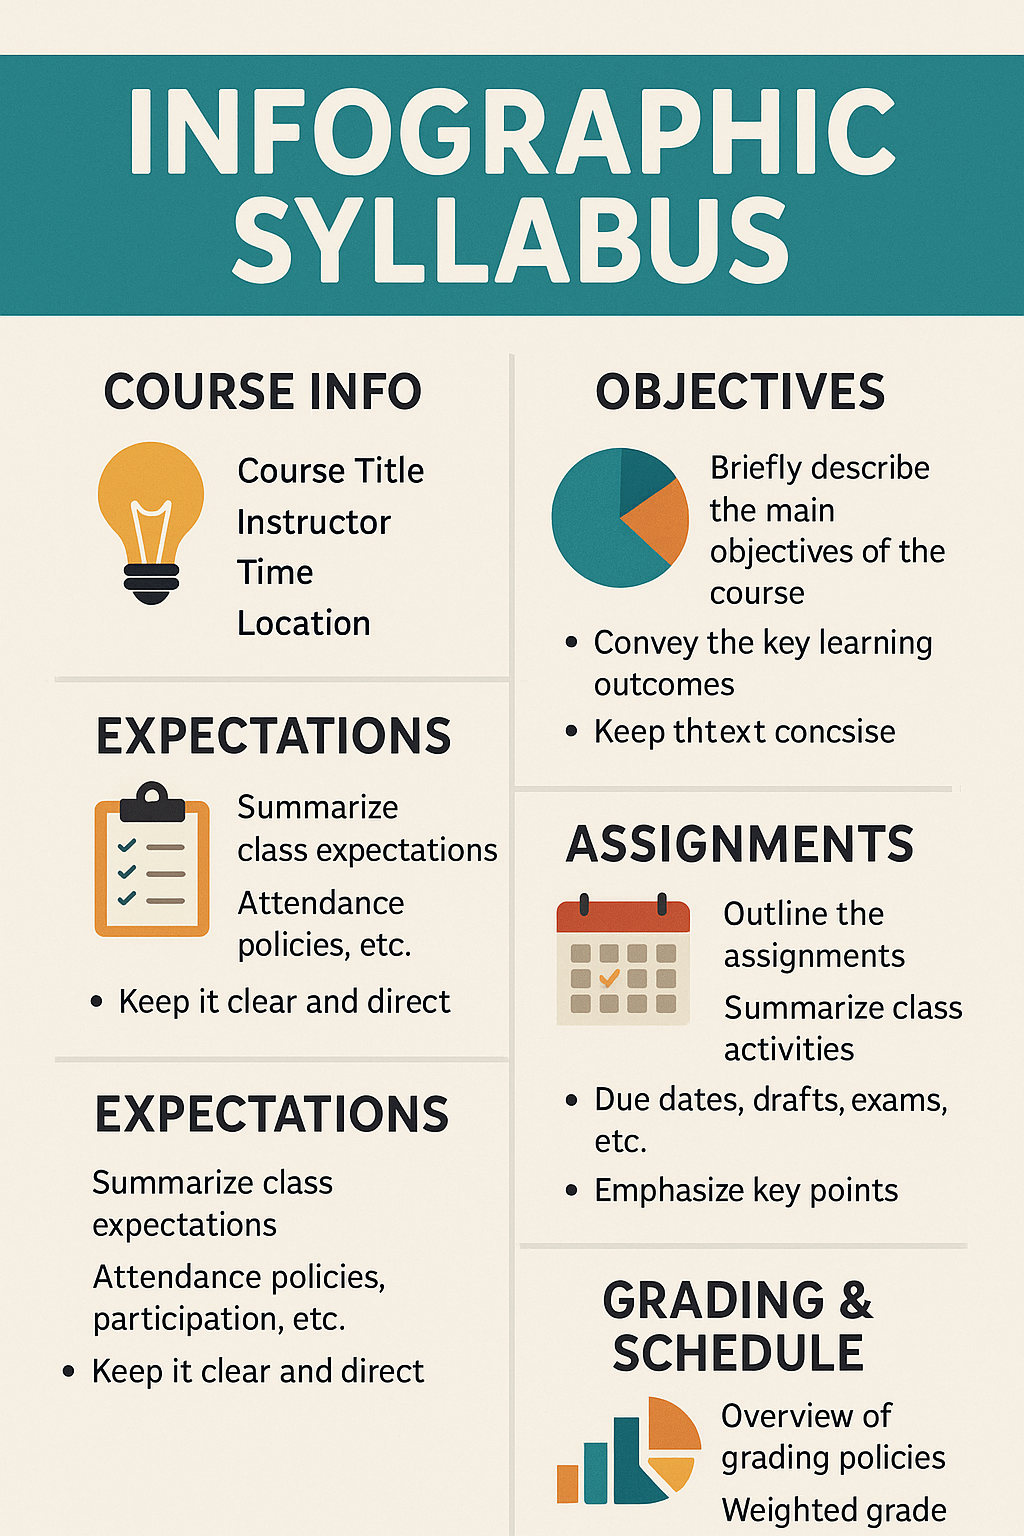
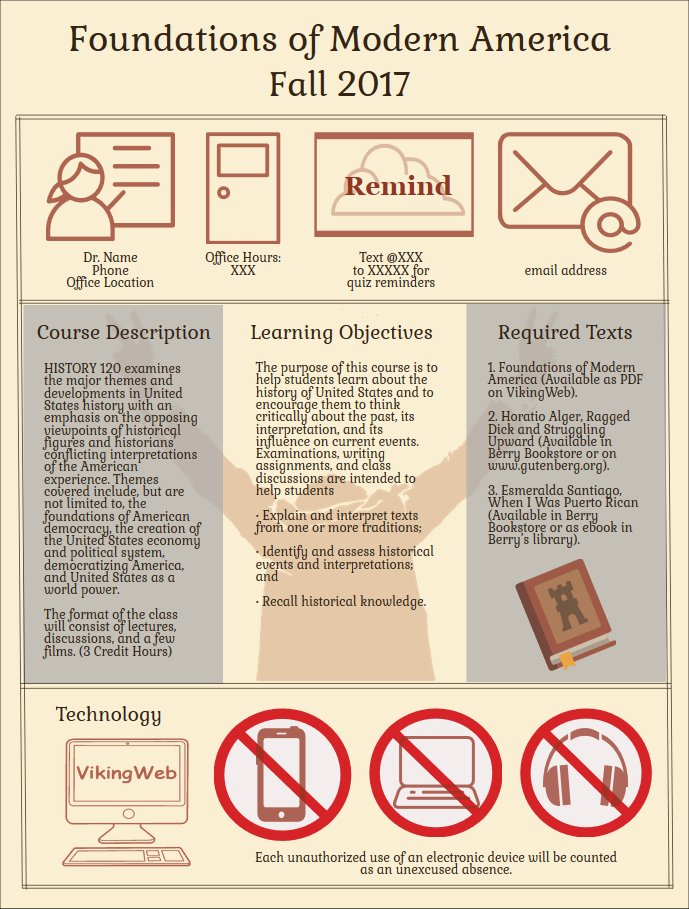
An infographic syllabus is a visual version of a traditional syllabus that presents essential course information—such as objectives, expectations, assignments, grading policies, and schedules—through graphics, icons, charts, and condensed text. Instead of relying solely on lengthy written descriptions, an infographic syllabus uses design elements to make key information easily accessible, engaging, and memorable for students. By highlighting the most important points visually, it supports different learning styles, reduces cognitive overload, and helps students quickly locate and understand critical course details.
Why Use an Infographic Syllabus?
Research on syllabi suggest that the format and content of the syllabus can
- Influence attitudes towards a course or instructor
- Enhance or hinder motivation for a course
- Impact retention of information from the syllabus
- Affect anxiety levels and comfort about a course
And that students prefer
- Warmth
- Clarity
- Brevity
An infographic syllabus provides
- Visual Appeal: Infographics are visually stimulating, capturing students’ attention more effectively than traditional text documents.
- Interactive Learning: A visually rich syllabus can spark interest and encourage students to explore course content more actively.
- Improved Clarity and Comprehension: Infographics distill complex information into easily digestible visual elements, making it easier for students to understand key points.
- Structured Layout: A well-organized infographic provides a clear overview of the course structure, highlighting essential details without overwhelming students with text.
- Increased Accessibility: Infographics cater to visual learners, helping them grasp information more effectively through images, icons, and charts.
- Easy Reference: An infographic syllabus is more likely to be revisited by students due to its appealing format, serving as a handy reference throughout the course.
How to Make and Use One
First Identify Key Elements: Focusing on essential elements ensures that the infographic is concise and informative, highlighting the most critical aspects of the course.
- Course Overview: Briefly describe the course, including its purpose, objectives, and relevance to OT practice.
- Instructor Information: Provide contact details, office hours, and preferred communication methods.
- Schedule and Topics: Outline the course schedule, including major topics, key dates, and important deadlines.
- Assignments and Assessments: Summarize the types and weight of assignments, assessments, and grading criteria.
- Resources: List required texts, recommended readings, and any other essential resources.
Choose a User-Friendly Design Tool: Using an intuitive design tool makes the process of creating an infographic syllabus accessible, even for those without a background in graphic design.
- Canva: Offers a wide range of templates and customization options, making it easy to create professional-looking infographics.
- Piktochart: Provides specific templates for educational materials, including syllabi, with drag-and-drop functionality.
- Venngage: Features a user-friendly interface and a variety of infographic templates tailored for education.
- Visme: Combines easy-to-use design tools with a variety of templates, allowing users to create visually engaging infographics with customizable elements and interactive features.
Design with Clarity and Consistency: A clear and consistent design enhances readability and ensures that students can easily navigate and understand the syllabus.
- Consistent Color Scheme: Use a consistent color palette that aligns with the course theme or institution’s branding.
- Readable Fonts: Choose clean, readable fonts and maintain consistent font sizes for headings, subheadings, and body text.
- Visual Hierarchy: Organize information using visual hierarchy, with headings, subheadings, and bullet points to guide the reader’s eye.
Integrate Interactive Elements: Interactive elements can make the syllabus more engaging and useful, providing students with easy access to additional information.
- Clickable Links: Embed hyperlinks to online resources, reading materials, and important course documents.
- QR Codes: Include QR codes that students can scan to access digital resources, course websites, or contact information quickly.
- Embedded Videos: Add links to introductory videos or welcome messages from the instructor to create a more personal connection.
Solicit Feedback and Iterate: Gathering feedback from students and colleagues helps refine the syllabus and ensure it meets the needs of all stakeholders.
- Pilot Testing: Share the infographic syllabus with a small group of students or colleagues and request feedback on its clarity, usefulness, and design.
- Adjustments: Make necessary adjustments based on the feedback to improve the overall effectiveness of the syllabus.
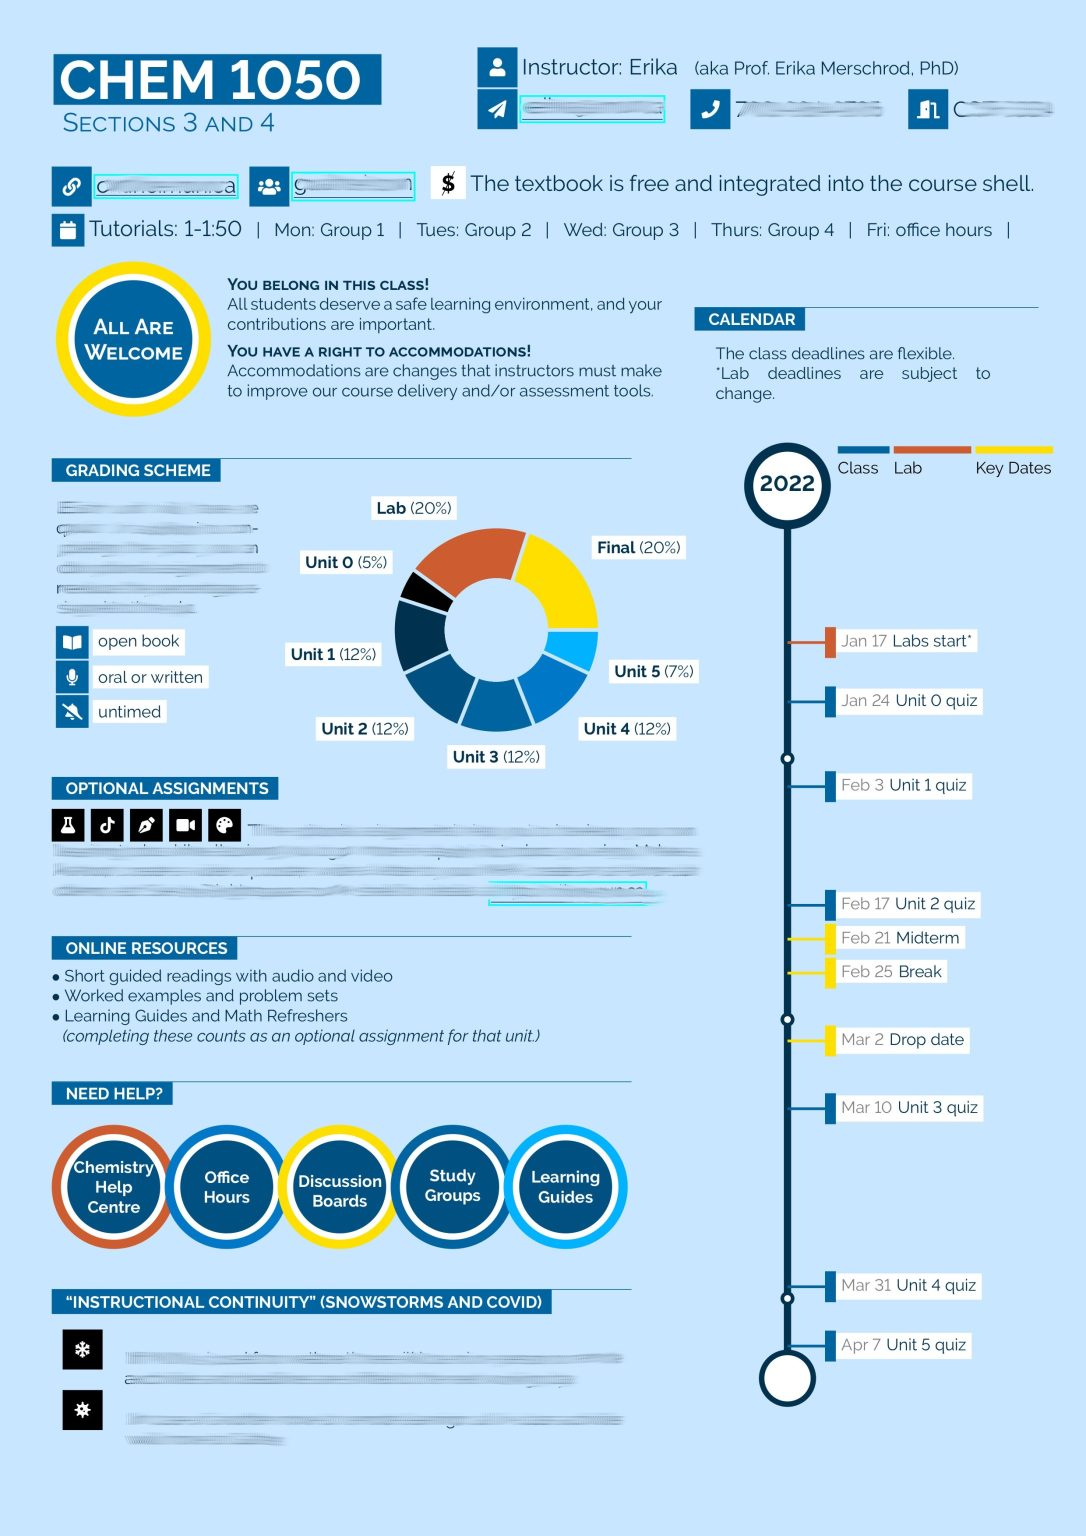
Examples to Provide Ideas for Your Design
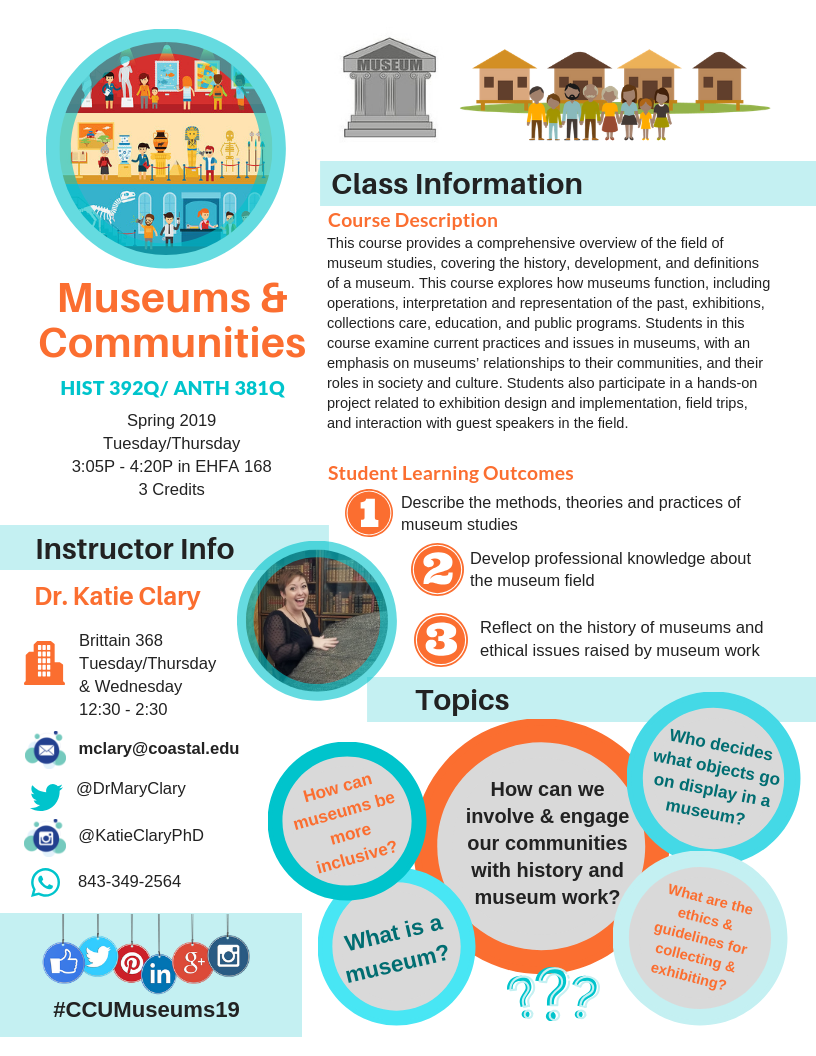
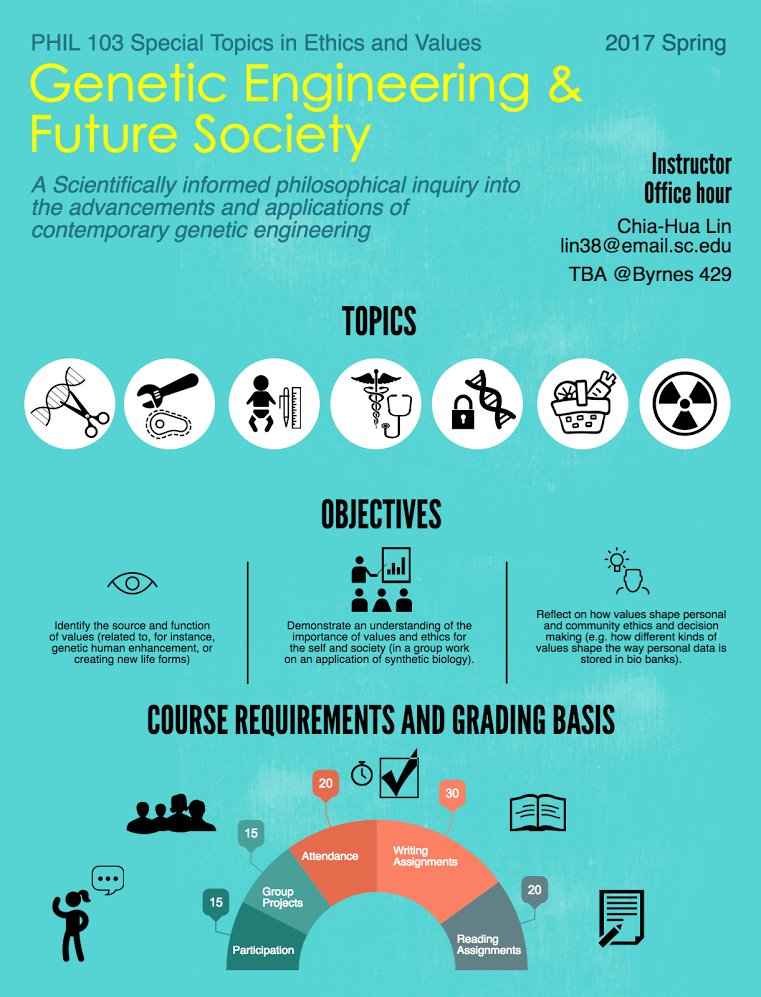
https://dailynous.com/2017/01/19/philosophy-syllabus-infographic/
https://visual.ly/community/Infographics/education/champlain-college-syllabus
_____________________________________________________________________
Resources to Learn More:
- https://ltlatnd.wordpress.com/2014/08/26/turn-your-syllabus-into-an-infographic/
- https://thevisualcommunicationguy.com/2017/08/14/how-to-turn-your-syllabus-into-an-infographic/
- Video https://www.youtube.com/watch?v=2iY6YAlWnAU&t=6s
- Ten tips for creating a more inviting syllabus https://journals.asm.org/doi/pdf/10.1128/jmbe.00032-23
References
Chandar, S., Crum, R., Pennino, E., Ishikawa, C., Ghosh Hajra, S., & McDonald, K. (2023). Ten tips for developing a more inviting syllabus. Journal of Microbiology and Biology Education, 24(3), e00032-23.
Kaur, A. W. (2021). ” Dope Syllabus”: Student Impressions of an Infographic-style Visual Syllabus. International Journal for the Scholarship of Teaching and Learning, 15(2), 6.
Kerrigan, J., & Bifulco, C. (2024). Syllabus 2.0: Using Videos to Make the Syllabus Active. College Teaching, 72(4), 369-378.
Kim, Y., & Ekachai, D. G. (2020). Exploring the effects of different online syllabus formats on student engagement and course-taking intentions. College Teaching, 68(4), 176-186.
Lightner, R., & Benander, R. (2018). First Impressions: Student and Faculty Feedback on Four Styles of Syllabi. International Journal of Teaching and Learning in Higher Education, 30(3), 443-453.
Palmer, M. S., Wheeler, L. B., & Aneece, I. (2016). Does the document matter? The evolving role of syllabi in higher education. Change: The Magazine of Higher Learning, 48(4), 36-47.
Wheeler, L. B., Palmer, M., & Aneece, I. (2019). Students’ perceptions of course syllabi: The role of syllabi in motivating students. International Journal for the Scholarship of Teaching and Learning, 13(3), 7.
Yarosh, J. H. (2021). The syllabus reconstructed: An analysis of traditional and visual syllabi for information retention and inclusiveness. Teaching Sociology, 49(2), 173-183.

Leave a comment